(Bloomberg) -- Bond traders have been boosting options and futures wagers that the Federal Reserve is about to signal deeper interest-rate cuts next year than the market anticipates.
A quarter-point rate reduction is seen as practically a lock on Wednesday, so a key focus will be the Fed’s update of its quarterly projections. In September, officials’ median forecast of their policy path — dubbed the dot plot — indicated a full percentage point of total rate cuts both this year and next.
With inflation proving sticky, however, Wall Street banks have started to anticipate that the Fed will forecast perhaps one fewer cut next year, meaning three-quarters of a point in total. And some predict the central bank may pencil in just a half-point, a level that’s broadly in line with what swaps markets are pricing in.
But in interest-rate options, some traders are betting that the market’s view is too hawkish, and that the Fed will hew more closely to what it projected in September: the equivalent of four quarter-point cuts in 2025, driving the implied fed funds target rate down to 3.375%.
These traders may have in mind how potential signs of labor-market fragility could boost wagers on steeper Fed easing, and how Treasuries rallied earlier this month on data showing an unexpected jump in the jobless rate.
In options linked to the Secured Overnight Financing Rate, which is highly sensitive to Fed policy expectations, demand has focused on dovish bets targeting early 2026 on structures expiring early next year. These positions stand to benefit should the central bank’s policy forecasts be more dovish than markets expect.
Along with this, traders are increasing positions in fed funds futures. Open interest has risen to a record in the February maturity, pricing on which is closely linked to the Fed’s December and January policy announcements. Recent flows around the tenor have skewed toward buying, indicating fresh wagers that would benefit from a December rate cut and then additional easing priced into the following decision on Jan. 29.
The bullish activity seemed to get a boost from Morgan Stanley’s buy recommendation this month on the February fed funds contract. Investors should position for a higher market-implied probability of a quarter-point cut on Jan. 29, strategists said. There’s now a roughly 10% chance priced in for such a move next month, assuming the Fed delivers what’s expected on Wednesday.
Further out the curve, positioning remains balanced, after traders moved to deleverage ahead of last week’s release of consumer-price data. This week’s JPMorgan Chase & Co. survey showed clients’ neutral stance was the most elevated in a month, suggesting they were taking chips off the table before Wednesday’s decision and going into year-end.
Here’s a rundown of the latest positioning indicators across the rates market:
JPMorgan Treasury Client Survey
In the week to Dec. 16, the latest survey of JPMorgan clients showed short positions dropping 2 percentage points and shifting into neutral, where positioning is now the most elevated in a month. Long positions were unchanged over the week.
Treasury Options Premium Favoring Puts
The cost to hedge a selloff in the long end of the Treasury curve has risen over the past week. The long-bond options skew is favoring puts by approximately the biggest amount since the first week of November. The move comes as 30-year yields peaked on Tuesday at the highest since Nov. 18. In options, flows have looked to fade the move in the skew, with demand for call structures seen over the past week. One example included upside February calls targeting a 4% yield on the 10-year by the end of January, relative to about 4.4% now.
Most Active SOFR Options
Over the past week, there has been a large amount of positions added across SOFR options out to the Sep25 contracts vs. liquidation. Open interest climbed extensively in the 95.875 strike following recent trades including a buyer of the SFRH5 95.625/95.875/96.125 call fly bought vs. selling SFRH5 95.8125 put and recent demand for the SFRH5 95.8125/95.875/95.9375 2x1x1 call tree. There was also increased demand for the 95.25 strike largely as a result of aggressive outright buying of the SFRH5 95.25 put, seen as new risk. The rise in demand for 95.625 strikes was largely down to a position build-up of the SFRM5 96.00/96.125 call spread bought vs. selling SFRM5 95.625/95.4375 put spread.
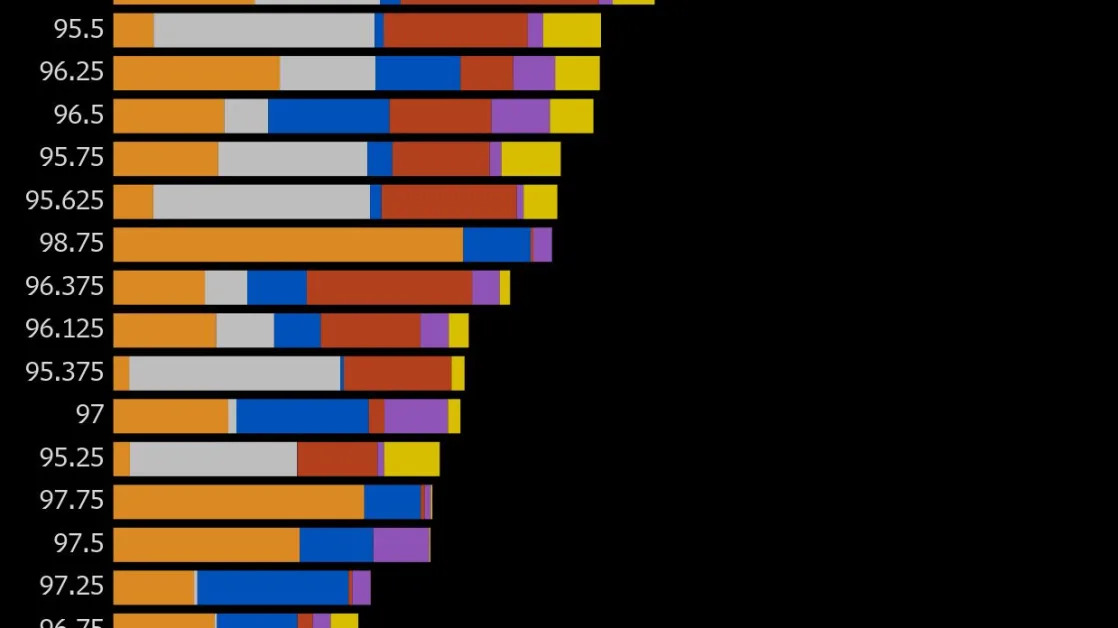
SOFR Options Heatmap
In SOFR options from the Mar25 out to the Sep25 quarterly tenors the 96.00 strike is the most populated, largely down to a heavy amount of Jun25 puts at that level. Recent flows around the strike have included a buyer of the Jun25 96.00/96.125 call spread vs. selling Jun25 95.625/95.4375 put spread which traded Friday for new risk. A large amount of outstanding positions also sits in the 95.875 strikes, helped by Mar25 call activity, including a buyer of the SFRH5 95.625/95.875/96.125 call fly vs. selling SFRH5 95.8125 puts.
CFTC Futures Positioning
Hedge funds covered short positions in the long-end of the Treasuries curve in the week to Dec. 10, CFTC data shows. Over the reporting week, hedge funds covered approximately 65,000 10-year note futures equivalents on net short position across the futures strip, while asset managers added roughly 18,000 10-year note futures equivalents to net long. Asset managers were most bullish ultra 10-year note futures where net long position was extended by around $2.8m per basis point. In SOFR futures over the week, hedge funds added to net long while asset managers added to net short.


