Key Takeaways
Apple ( AAPL ) shares are in the spotlight after setting another record closing high Thursday as optimism grows that the iPhone maker’s artificial intelligence (AI) features could accelerate 2025 sales growth.
Earlier this week, the company rolled out additional Apple Intelligence features across its devices through its iOS 18.2 operating system, including ChatGPT integration with Siri , image generation tools, and the ability for users to create custom emojis. Analysts anticipate ongoing feature releases will prompt a continuous upgrade cycle, helping to drive sales.
In a recent research note, Wedbush analyst Dan Ives said that he expects Apple to be the first company to reach a $4 trillion market capitalization as AI continues to underpin tech stocks in 2025. Apple shares have gained nearly 30% since the start of this year as of Thursday’s close, slightly outpacing the S&P 500’s performance over the same period.
The stock was little changed at around $248 in premarket trading Friday.
Below, we take a closer look at the technicals on Apple’s chart and point out important price levels that investors may be watching.
Uptrend Continues on Decreasing Volume
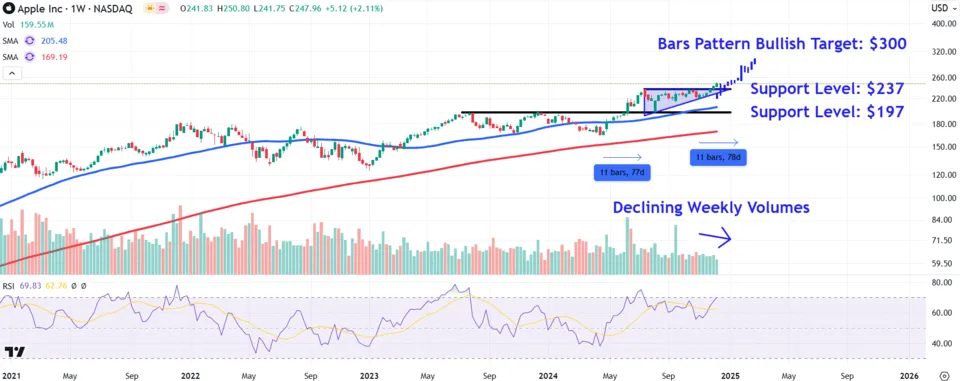
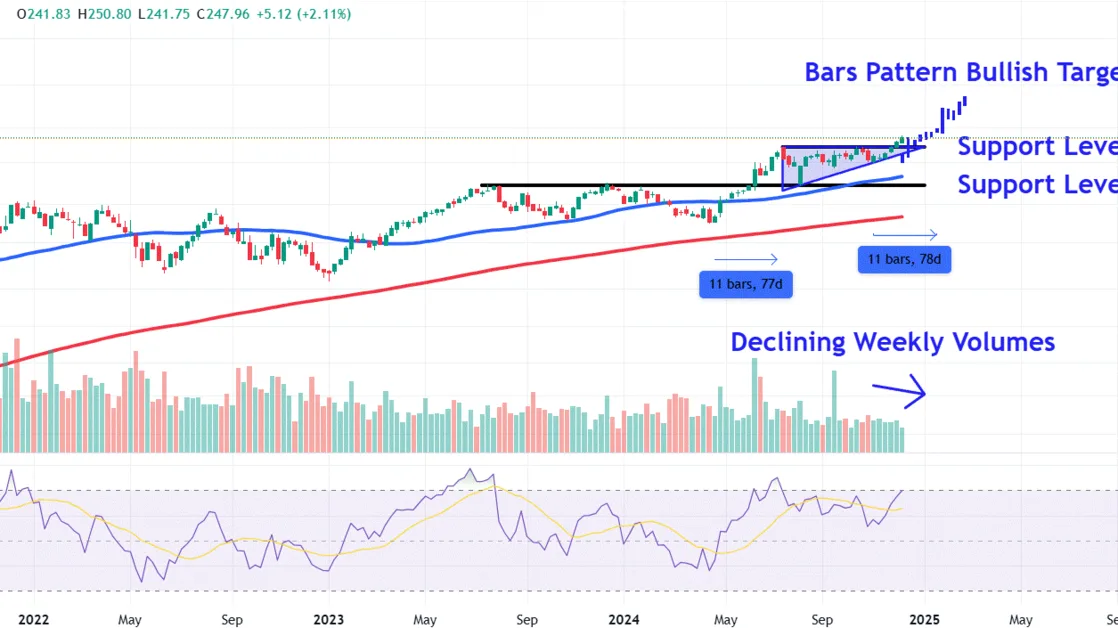
Since finding buying interest near the lower trendline of an ascending triangle in early November, Apple shares have continued to trend sharply higher, with the price breaking out above the bullish chart pattern earlier this month.
While the move indicates a continuation of the stock’s longer-term uptrend, it’s worth noting that declining weekly trading volumes suggest that larger market participants, such as institutional investors and hedge funds, may remain on the sidelines.
Let’s use technical analysis to forecast how a continuation move in Apple shares may play out and also identify two major levels that could provide support during pullbacks .
Bars Pattern Analysis
Investors can use the bars pattern tool to project a potential bullish price target and forecast how long the stock’s current uptrend may last.
To predict a price target, we extract the trending price bars that preceded the ascending triangle and reposition them from the start of the current move higher. This forecasts a bullish target of around $300, a psychological round number area where investors may decide to lock in profits .
When projecting the timing of a possible continuation move, we analyze the date range of the prior trend, which in this case, took place over 11 weeks. This indicates the current move higher could play out until late January if price history rhymes.
Major Support Levels to Watch During Retracements
The first area to watch during an initial retracement sits around $237, a location on the chart where investors who prefer not to chase breakouts could seek entry points near the ascending triangle’s top trendline.
Finally, a steeper decline in Apple shares could see the price revisit lower support at the $197 level. This area, currently sitting just below the 50-week moving average, would likely encounter buying interest near a trendline that links the July and December 2023 peaks with this year’s August low.
The comments, opinions, and analyses expressed on Investopedia are for informational purposes only. Read our warranty and liability disclaimer for more info.
As of the date this article was written, the author does not own any of the above securities.
Read the original article on Investopedia


