
Chart of the Week: OReefer Outbound Tender Reject Index, Van Outbound Tender Reject Index – USA SONAR : ROTRI.USA, VOTRI.USA
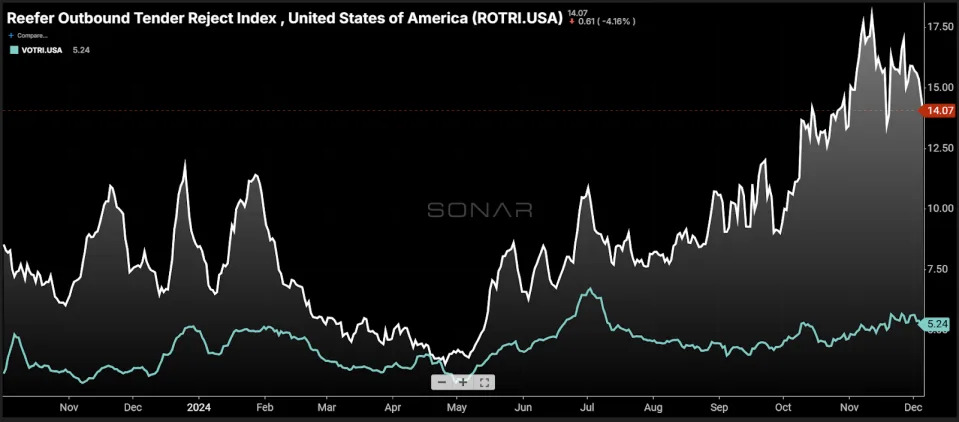
National refrigerated (reefer) tender rejection rates (ROTRI) have been averaging above 14% since early October, compared to around 8% during the same period in 2023. This significant jump and sustained trend suggest the refrigerated truckload market is entering a more challenging transportation procurement environment as we approach the ironically named “protect-from-freeze” season.
Tender rejection rates measure the frequency with which carriers decline load coverage requests from contracted customers due to capacity constraints. Higher rejection rates reflect a favorable environment for truckload operators, indicating that demand exceeds available supply, increasing the value of their services.
While the reefer and dry van truckload markets are loosely connected, national dry van rejection rates (VOTRI) typically correlate with refrigerated rates but operate at a lower level.
In 2019, the ROTRI averaged above 15%, while the VOTRI averaged just over 5%. During the pandemic peak in 2021, the ROTRI surged to nearly 40%, with the VOTRI averaging 23%. Over the past two years, the gap between the two indices has been unusually narrow. In 2023, the ROTRI averaged a historic low of 5.3%, compared with 3.4% for the VOTRI, reflecting a loose truckload market.
The difference in volume helps explain the divergence between these indices. Dry van shipments account for roughly 60%-70% of the data, while refrigerated shipments make up only 10%-20%. This smaller sample size makes the ROTRI inherently more volatile, highlighting the significance of its muted responsiveness in 2022-2023.
Another head fake?
In 2023, the reefer market initially appeared to be tightening, driven by regional disruptions in the Northwest and Midwest.

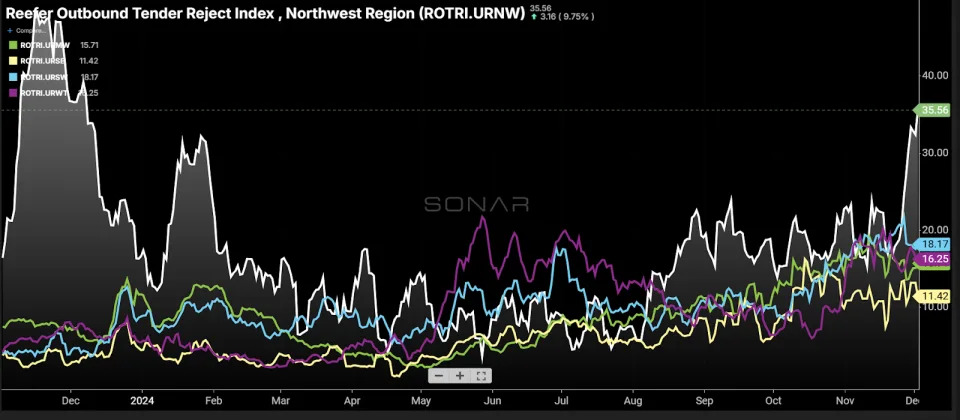
Northwestern rejection rates neared 50% by late November, while Midwest reefer rejection rates, typically above 8% during the fall, spiked to 13% around Christmas and during January’s arctic cold snap.
The Northwest contributes only about 5% of refrigerated tenders, whereas the Midwest, representing about 35%, has a greater influence on the national average. Consequently, changes in larger-volume regions have a more significant impact.
Rejection rates fell back to near-record lows in the spring as the market recovered on the heels of warmer weather in February and March.
This year, Northwestern rejection rates (ROTRI.URNW) are less pronounced, but rejection rates across other U.S. regions are higher and increasingly volatile. This indicates reduced overall capacity and a more uniformly tightening market, less reliant on seasonal pressures.
On the spot
Despite rising rejection rates, the spot market has yet to experience significant inflationary pressure. Although national rate-per-mile averages may be skewed by the inclusion of longer hauls, supply and demand imbalances usually become apparent over time.

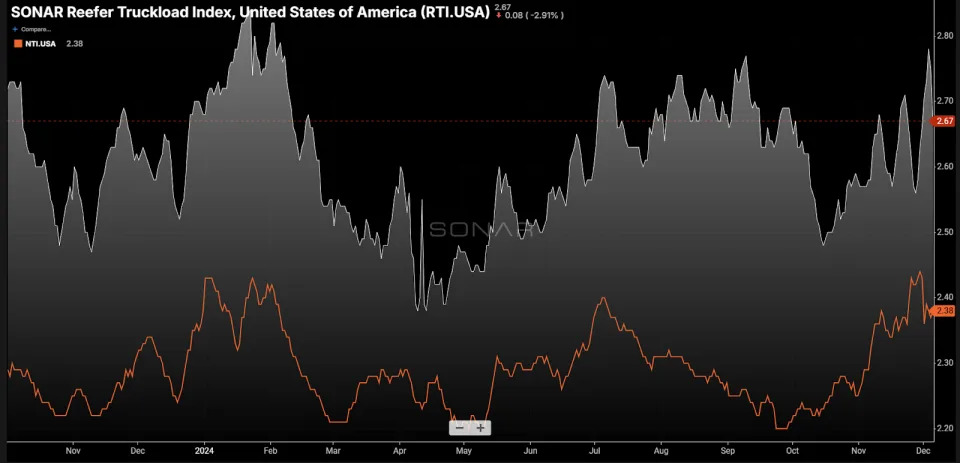
The Reefer Truckload Index (RTI), which tracks average spot rates for refrigerated loads exceeding 250 miles, has been more volatile but has not sustained higher levels than those seen during the summer. Notably, the RTI has not surpassed the weather-driven spike in January, even with two landfalling hurricanes this fall.
This lack of sustained upward pressure suggests that the spot market is not yet experiencing consistent demand growth for refrigerated shipments. Shippers are not resorting to spot market sourcing at levels comparable to last January, relying instead on their existing carrier networks.
However, securing refrigerated capacity in the contracted market is clearly more challenging than in previous years. Reefer contract rates are often below spot prices, reducing the incentive to drive spot rates higher. Instead, carriers are prioritizing seasonal spot freight without significant negotiation.
Winter outlook
Weather conditions will likely determine how strong this market shift is during the winter months. Reefer trailers, which are not only used for cooling but also for maintaining stable temperatures to protect goods from freezing, play a crucial role in the “protect-from-freeze” season. If this winter is particularly cold, demand for reefer capacity is expected to remain strong.
The van market may not be tightening at the same clip as its refrigerated counterpart, but it will be a determining factor in how sustained this shift in capacity will be.
About the Chart of the Week
The FreightWaves Chart of the Week is a chart selection from SONAR that provides an interesting data point to describe the state of the freight markets. A chart is chosen from thousands of potential charts on SONAR to help participants visualize the freight market in real time. Each week a Market Expert will post a chart, along with commentary, live on the front page. After that, the Chart of the Week will be archived on FreightWaves.com for future reference.
SONAR aggregates data from hundreds of sources, presenting the data in charts and maps and providing commentary on what freight market experts want to know about the industry in real time.
The FreightWaves data science and product teams are releasing new datasets each week and enhancing the client experience.
To request a SONAR demo, click here .
The post Reefer market tightens: Rising tender rejections signal shifting dynamics appeared first on FreightWaves .


