Shares Have Climbed 24% During S&P 500's Six-Session Winning Streak

Key Takeaways
Nvidia ( NVDA ) shares will likely remain in the spotlight Friday as investors watch on with interest to see if the artificial intelligence (AI) darling can continue its impressive recovery from recent lows.
The stock, which has surged 24% over the past six sessions and helped propel a broader recovery for U.S. equities , has been bolstered by favorable brokerage commentary from Goldman Sachs, Bank of America, UBS and others, who view the stock’s recent correction as a buy the dip opportunity.
Nvidia shares were up 0.2% at $123.10 in premarket trading Friday about 90 minutes before the opening bell. The stock closed at $98.91 on Aug. 7, its lowest level since late May, before rallying the last several days.
Below, we take a closer look at Nvidia’s chart and use technical analysis to dial in on key price levels likely to attract attention.
Volume Indicates Retail-Driven Recovery
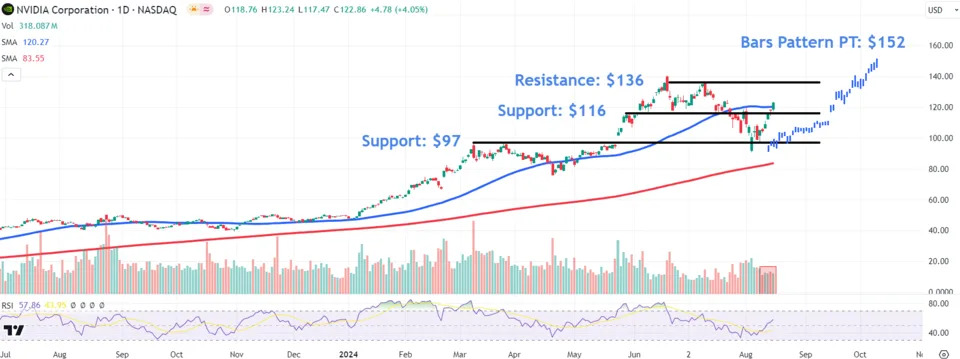
After setting a record high on June 20, Nvidia shares retraced as much as 36% before finding support around two prior March peaks during the broad-based equities sell-off on Monday last week. Since then, the stock has staged a remarkable recovery to reclaim the 50-day moving average (MA) in yesterday's trading session.
However, it’s worth pointing out the reversal has occurred on below-average volume , indicating the move may be driven by retail investors rather than larger market participants.
Looking ahead, investors should monitor several crucial price levels in Nvidia shares that will likely remain in focus.
Support Areas to Watch
The first sits at $116, around 6% below Thursday’s close. This area could provide support during initial profit-taking near a horizontal line linking the May high with a countertrend peak that formed during the stock’s impulsive move lower between mid-July and early August.
A close below this level could see the shares revisit $97, the region bulls successfully defended during the Aug. 5 selling rout, which also closely aligns with two peaks in March that capped the strong trending move from January to early March.
Upside Price Levels to Monitor
Ongoing short-term price momentum could carry Nvidia shares to $136, where they would likely run into selling pressure near the June 18 record close and July swing high , especially if other technical indicators confirm overbought conditions at the same time.
To project a new price target above the stock's all-time high (ATH) , we can use a bars pattern. We do this by extracting the trending move from April to June and applying it from this month’s low, which predicts a target of around $152.
The comments, opinions, and analyses expressed on Investopedia are for informational purposes only. Read our warranty and liability disclaimer for more info.
As of the date this article was written, the author does not own any of the above securities.
Read the original article on Investopedia .


