Key Takeaways
Constellation Energy ( CEG ) shares could remain in focus on Monday after surging more than 25% Friday as the energy giant announced that it will acquire rival Calpine in a deal valued at $26.6 billion.
The transaction, which expands Constellation’s footprint in Texas, California, and in the Northeast, comprises of stock and cash, while also assuming about $12.7 billion of Calpine’s net debt.
Constellation Energy shares have more than doubled in the last year and traded 36% higher year to date (YTD) as of Friday’s close, boosted by increasing power demand to meet artificial intelligence (AI) computing resources. In September last year, the company said it planned to restart the Three Mile Island Unit 1 nuclear plant in Pennsylvania to provide electricity for Microsoft's ( MSFT ) data centers.
Below, we take a closer look at the technicals on Constellation Energy’s chart and point out important price levels to watch after Friday’s news -driven pop.
Falling Wedge Breakout
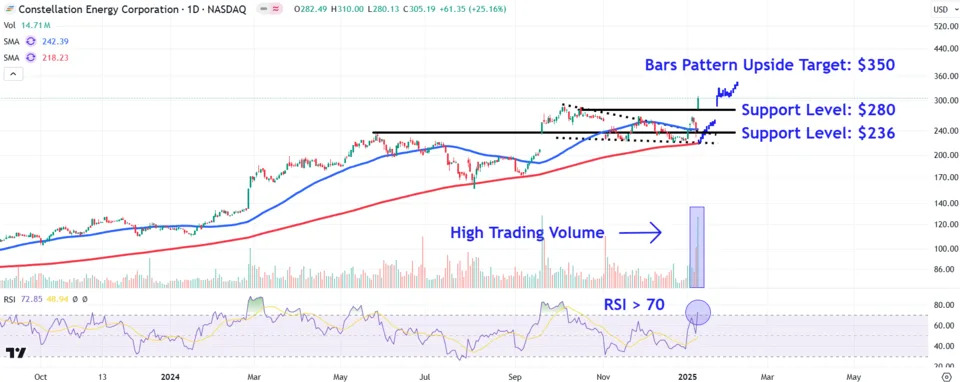
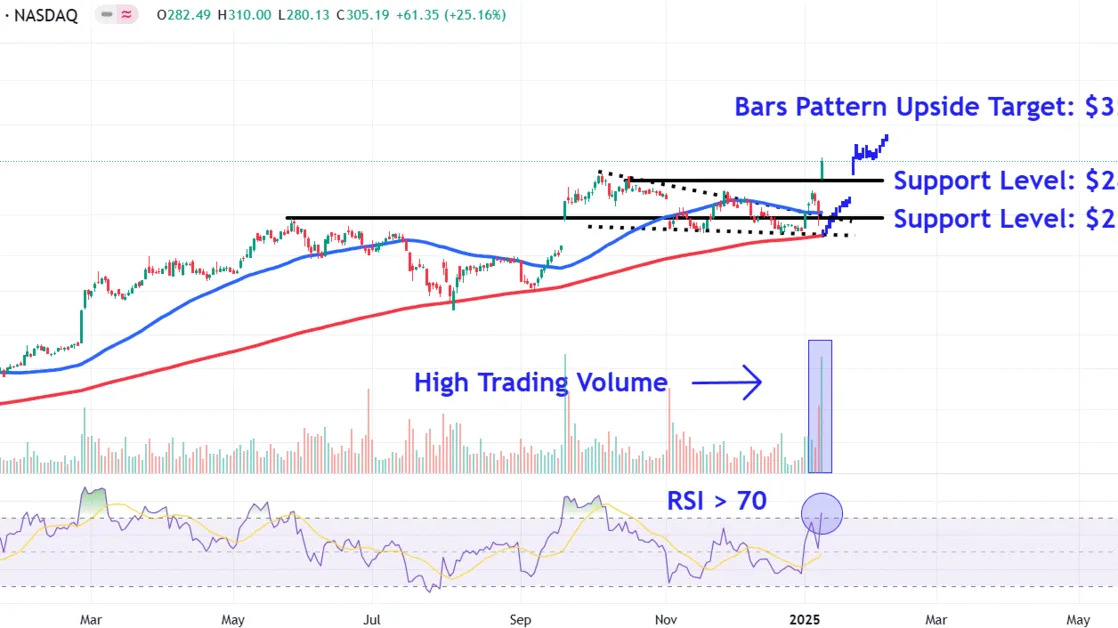
Constellation Energy shares broke out from a falling wedge pattern earlier this month, briefly retraced to the pattern's upper trendline, and then staged a breakaway gap to a new all-time high (ATH) on Friday.
Importantly, Friday’s surge occurred on the third highest day of trading volume since the energy giant went public in early 2022, signaling buying conviction from larger market participants, such as institutional investors and hedge funds.
The relative strength index (RSI) confirms bullish price momentum with a reading above 70, but also indicates overbought conditions, opening the door to short-term profit taking.
Let’s turn to technical analysis to forecast a potential upside price target and identify key support levels that may come into play during retracements.
Upside Price Target to Watch
To project an upside target, investors can use the bars pattern tool. When applying the analysis to Constellation Energy's chart, we extract the price bars comprising the stock’s uptrend that preceded the falling wedge and reposition them from the pattern’s lower trendline. The technique forecasts a target of around $350, about 15% above Friday’s closing price.
Interestingly, the prior trend used in the analysis also included a breakaway gap of over 20% to a record high, indicating the stock may continue its upward momentum for several more weeks before consolidating if price history rhymes.
Key Support Levels to Monitor
During retracements, investors should initially monitor the $280 level. The shares may find support in this area near a trendline that links the mid-October countertrend peak with the low of Friday’s breakaway gap.
Finally, the bulls’ inability to defend this price could see a pullback to around the $236 level. Investors may look for buying opportunities in this region that finds a confluence of support from the prominent May swing high , the 50-day moving average , and the falling wedge pattern’s upper trendline.
The comments, opinions, and analyses expressed on Investopedia are for informational purposes only. Read our warranty and liability disclaimer for more info.
As of the date this article was written, the author does not own any of the above securities.
Read the original article on Investopedia


